Project: Using anonymized smart-device data to quantify human activity in parks and green spaces
Year: 2022 - present
Focus Area: Ecosystem Services (People and Nature)
Project Overview
Parks and green spaces are integral components of our society. In cities, parks provide several ecosystem services that directly benefit city residents, such as regulating heat, supporting local biodiversity, and providing spaces for recreation. In the interest of managing these spaces to maximize these benefits, city planners and park managers require an understanding of human activity in green spaces.
We use anonymized smart-device data from Mapbox to understand how people use urban green spaces. In collaboration with the Center for Urban Environments at the University of Toronto’s School of Cities, we examined patterns of human activity in 53 urban green spaces managed by Conservation Halton in the Greater Toronto Area. We identified the parks that people visited most frequently and quantified the amount of on-trail vs. off-trail activity. With the City of Toronto, we identified which properties were visited most often and determined if park-specific amenities, such as sports fields or parking lots, encouraged visitation.
We have pioneered a methodology that overcomes many of the challenges that arise when applying anonymized smart-device data to quantify human activity patterns in urban green spaces. For example, our method corrects for spatial artefacts in activity patterns that can arise because urban parks can often be situated next to areas of high traffic (e.g., highways, high-density commercial areas). Validation of our adjusted activity index derived from the Mapbox data showed a strong correlative relationship when compared with reservation data for select properties managed by Conservation Halton. Our findings have been used to identify potential management implications for applying anonymized smart-device data in supporting urban green spaces, such as:
- Quantifying park accessibility to residents
- Determining wildlife connectivity between green spaces
- Predicting changes in park use with urban development
- Identifying desire lines and points-of-interest
- Understanding human-wildlife interactions
- Revising park amenities or resources
We are building upon this work through a collaboration with the City of Toronto and the Toronto and Region Conservation Authority to determine how park activity might increase with climate change and urbanization. We are also working with Environment and Climate Change Canada to understand how human activity in parks might impact urban birds.

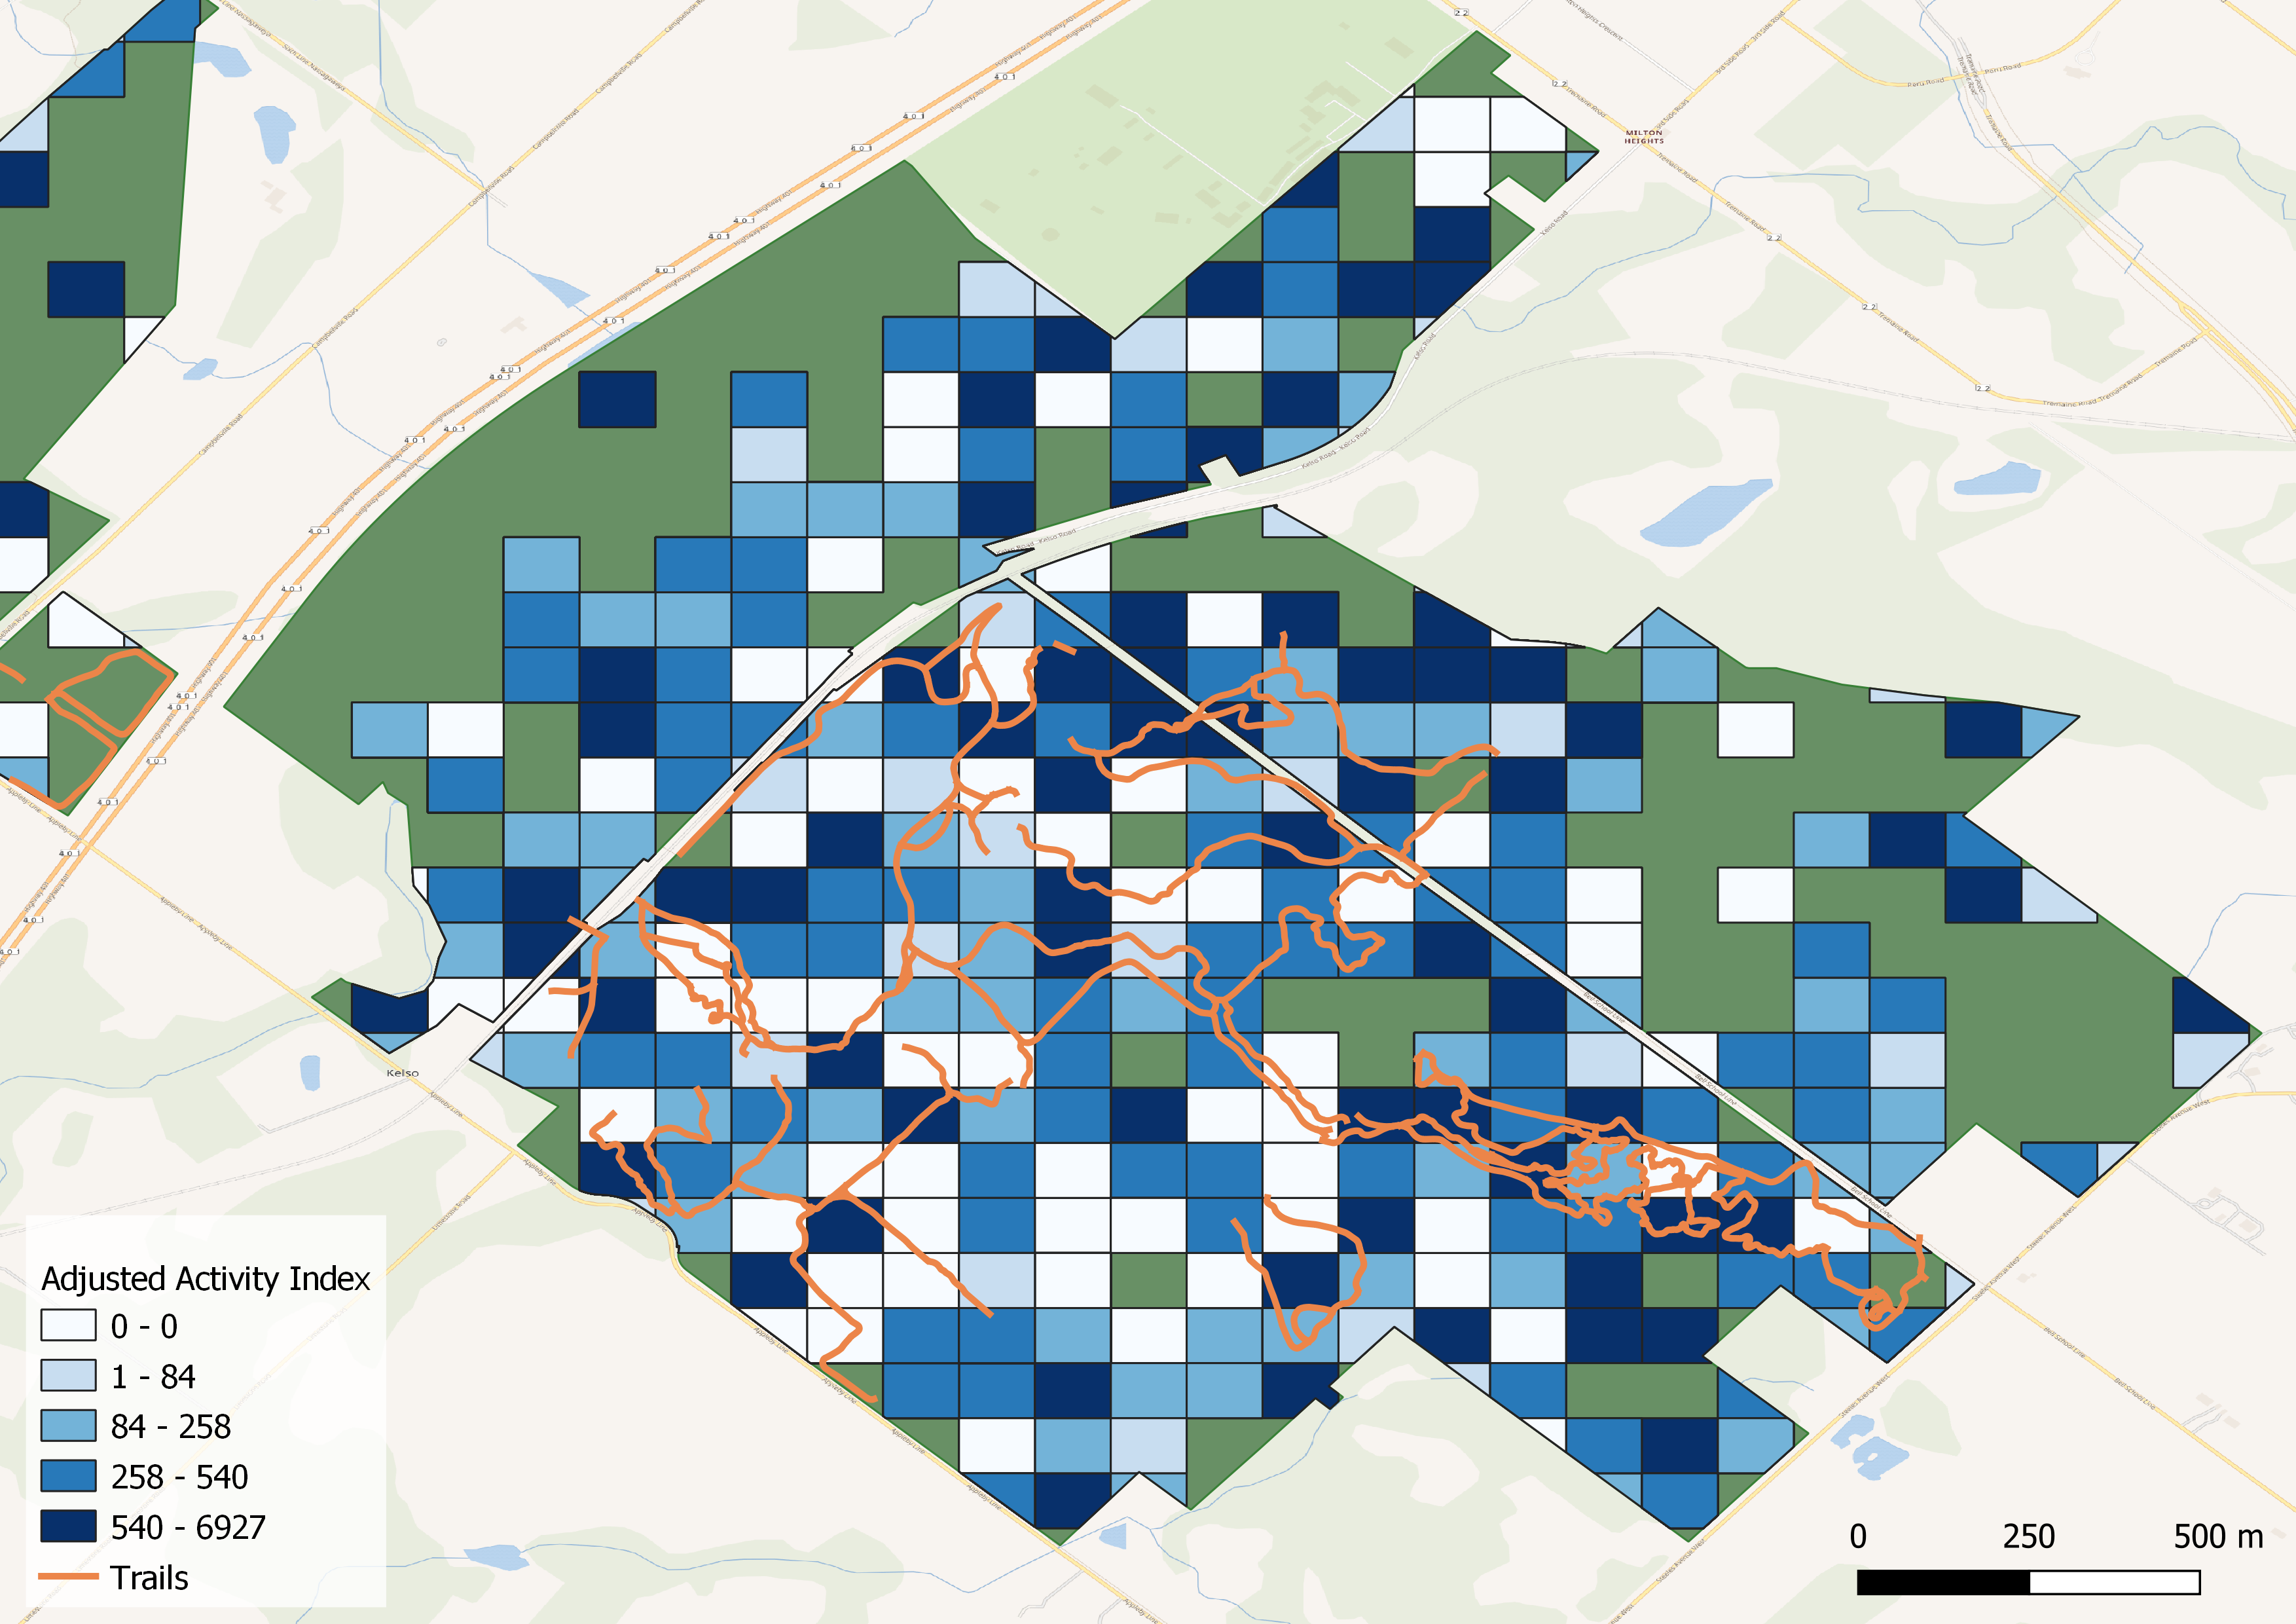
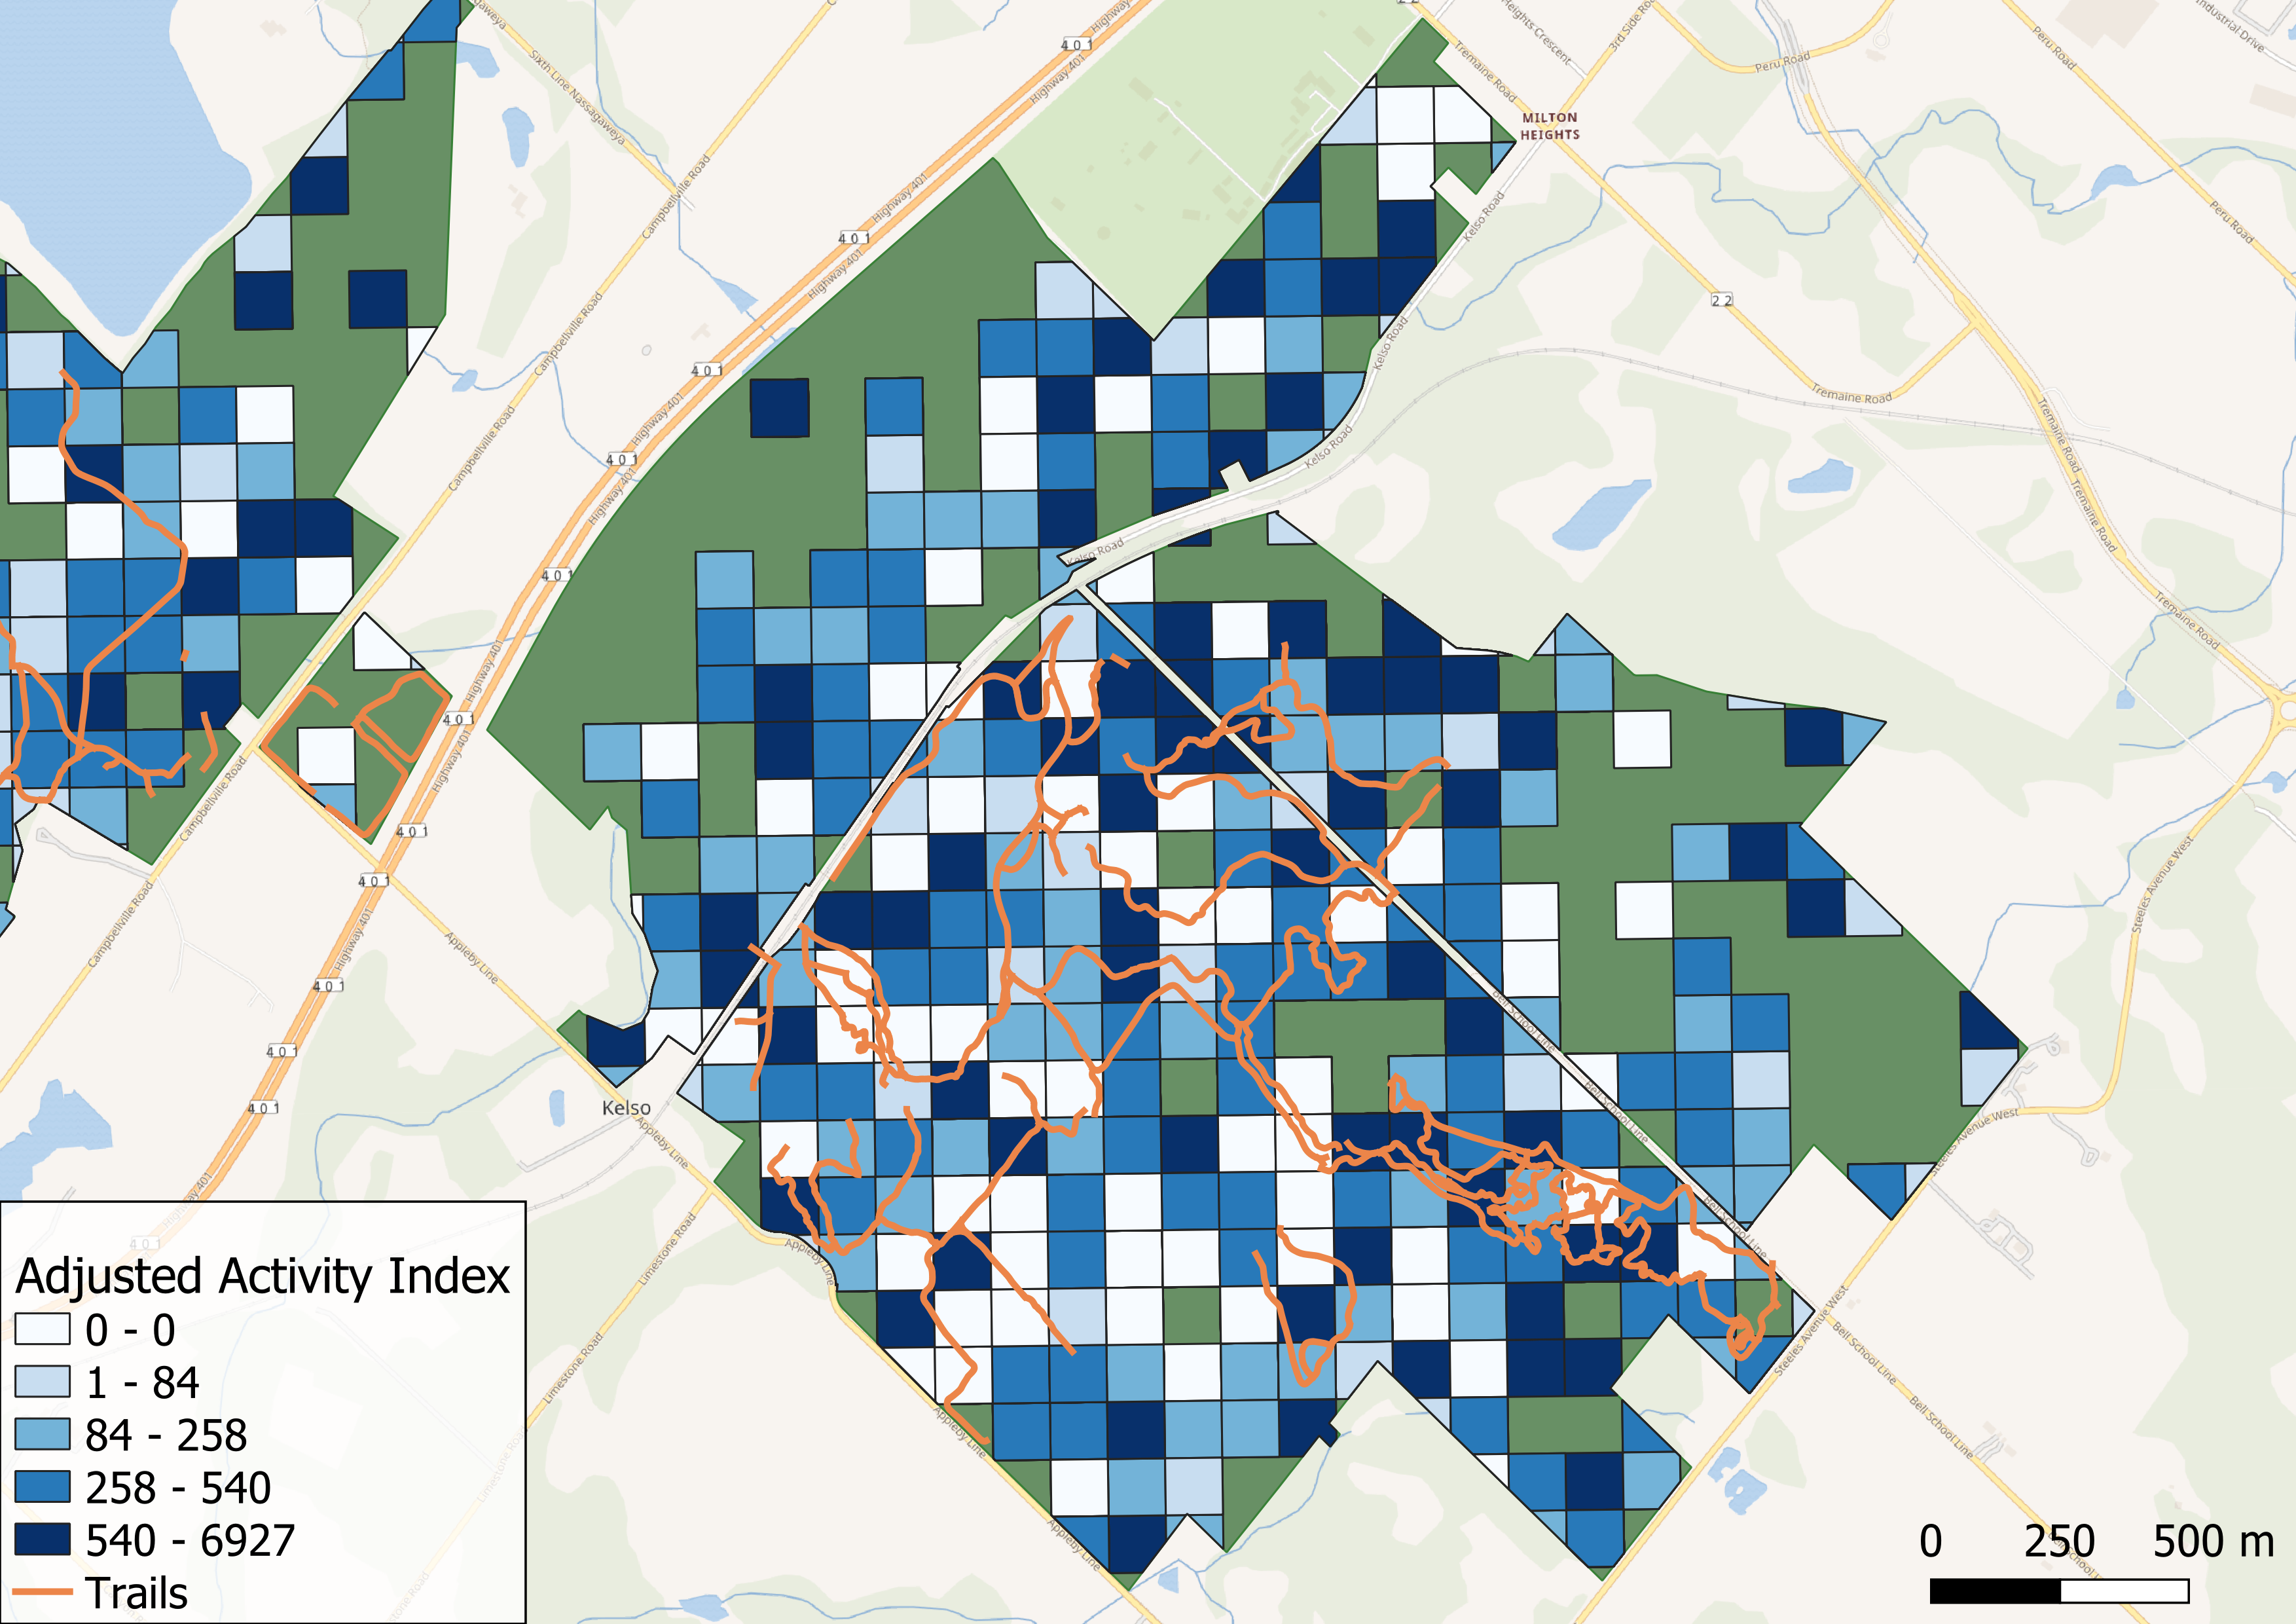
Figure 1. Peak activity patterns calculated from Mapbox activity data highlighted in 100 x 100 m grid cells in Kelso Conservation Area, Milton, Ontario. Areas in darker blue represent more human activity and orange lines represent official park trails.
Additional Information
Filazzola, A., Xie, G., Barrett, K., Dunn, A., Johnson, M. T., and MacIvor, J. S. 2022. Using smartphone-GPS data to quantify human activity in green spaces. PLOS Computational Biology.

Figure 1. Peak activity patterns calculated from Mapbox activity data highlighted in 100 x 100 m grid cells in Kelso Conservation Area, Ontario, Canada. Areas in darker blue represent more human activity and orange lines represent official park trails.
Project:
Using anonymized smart-device data to quantify human activity in parks and green spaces
Clients: City of Toronto, Conservation Halton, Toronto and Region Conservation Authority
Year: 2022 - present
Focus Areas: Ecosystem Services (People and Nature)
Project Overview
Parks and green spaces are integral components of our society. In cities, parks provide several ecosystem services that directly benefit city residents, such as regulating heat, supporting local biodiversity, and providing spaces for recreation. In the interest of managing these spaces to maximize these benefits, city planners and park managers require an understanding of human activity in green spaces.
We use anonymized smart-device data from Mapbox to understand how people use urban green spaces. In collaboration with the Center for Urban Environments at the University of Toronto’s School of Cities, we examined patterns of human activity in 53 urban green spaces managed by Conservation Halton in the Greater Toronto Area. We identified the parks that people visited most frequently and quantified the amount of on-trail vs. off-trail activity. With the City of Toronto, we identified which properties were visited most often and determined if park-specific amenities, such as sports fields or parking lots, encouraged visitation.
We have pioneered a methodology that overcomes many of the challenges that arise when applying anonymized smart-device data to quantify human activity patterns in urban green spaces. For example, our method corrects for spatial artefacts in activity patterns that can arise because urban parks can often be situated next to areas of high traffic (e.g., highways, high-density commercial areas). Validation of our adjusted activity index derived from the Mapbox data showed a strong correlative relationship when compared with reservation data for select properties managed by Conservation Halton. Our findings have been used to identify potential management implications for applying anonymized smart-device data in supporting urban green spaces, such as:
- Quantifying park accessibility to residents
- Determining wildlife connectivity between green spaces
- Predicting changes in park use with urban development
- Identifying desire lines and points-of-interest
- Understanding human-wildlife interactions
- Revising park amenities or resources
We are building upon this work through a collaboration with the City of Toronto and the Toronto and Region Conservation Authority to determine how park activity might increase with climate change and urbanization. We are also working with Environment and Climate Change Canada to understand how human activity in parks might impact urban birds.

Figure 1. Peak activity patterns calculated from Mapbox activity data highlighted in 100 x 100 m grid cells in Kelso Conservation Area, Milton, Ontario. Areas in darker blue represent more human activity and orange lines represent official park trails.
Additional Information
Filazzola, A., Xie, G., Barrett, K., Dunn, A., Johnson, M. T., and MacIvor, J. S. 2022. Using smartphone-GPS data to quantify human activity in green spaces. PLOS Computational Biology.
